 Robbie Tarrant

8
BYE
NA
PTA
STK
7:40PMFRI
April 26
Adelaide Oval
NTH
ADE
1:45PMSAT
April 27
Blundstone Arena
GEE
CAR
4:35PMSAT
April 27
MCG
FRE
WBD
7:30PMSAT
April 27
Optus Stad.
GCS
WCE
1:00PMSUN
April 28
Heritage Bank Stad.
HAW
SYD
4:00PMSUN
April 28
MCG

Ads provide web developers the support to continue providing their services. If our ads are of annoyance, please provide recommendations to help us improve.
Robbie Tarrant
2012 Yearly Statistics
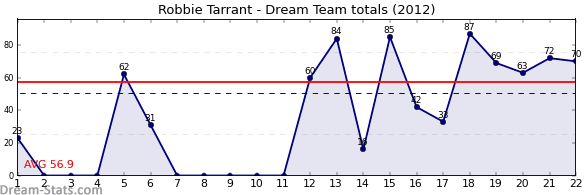
| OPP | RND | DT | D | K | H | M | T | HO | FF | FA | G | B |
|---|---|---|---|---|---|---|---|---|---|---|---|---|
| ESS | 1 | 23 | 5 | 3 | 2 | 2 | 1 | 0 | 0 | 0 | 0 | 0 |
| GCS | 5 | 62 | 18 | 10 | 8 | 4 | 0 | 0 | 2 | 0 | 0 | 2 |
| WCE | 6 | 31 | 8 | 5 | 3 | 3 | 0 | 0 | 1 | 0 | 0 | 0 |
| GCS | 12 | 60 | 12 | 10 | 2 | 4 | 2 | 1 | 2 | 0 | 0 | 3 |
| ADE | 13 | 84 | 11 | 11 | 0 | 8 | 1 | 0 | 0 | 1 | 4 | 2 |
| STK | 14 | 16 | 4 | 3 | 1 | 1 | 1 | 0 | 0 | 3 | 1 | 1 |
| WCE | 15 | 85 | 13 | 11 | 2 | 7 | 1 | 0 | 0 | 1 | 4 | 2 |
| CAR | 16 | 42 | 8 | 5 | 3 | 0 | 3 | 0 | 2 | 0 | 1 | 1 |
| RIC | 17 | 33 | 9 | 4 | 5 | 2 | 1 | 0 | 1 | 0 | 0 | 0 |
| MEL | 18 | 87 | 16 | 10 | 6 | 4 | 2 | 0 | 3 | 1 | 4 | 1 |
| WBD | 19 | 69 | 13 | 9 | 4 | 6 | 1 | 0 | 0 | 2 | 3 | 0 |
| ESS | 20 | 63 | 9 | 4 | 5 | 3 | 3 | 0 | 2 | 0 | 3 | 0 |
| COL | 21 | 72 | 10 | 8 | 2 | 5 | 3 | 0 | 0 | 1 | 3 | 2 |
| FRE | 22 | 70 | 15 | 11 | 4 | 5 | 2 | 0 | 4 | 0 | 0 | 2 |
| GWS | 23 | 35 | 10 | 5 | 5 | 2 | 2 | 0 | 2 | 2 | 0 | 0 |
| WCE | 24 | 16 | 6 | 3 | 3 | 1 | 1 | 0 | 0 | 2 | 0 | 0 |
| SUM | 848 | 167 | 112 | 55 | 57 | 24 | 1 | 19 | 13 | 23 | 16 | |
| AVG | 53.0 | 10.4 | 7.0 | 3.4 | 3.6 | 1.5 | 0.1 | 1.2 | 0.8 | 1.4 | 1.0 |
Ads provide web developers the support to continue providing their services. If our ads are of annoyance, please provide recommendations to help us improve.