 Will Day

19
BYE
NA
MEL
GEE
7:40PMFRI
July 24
MCG
FRE
WCE
8:10PMFRI
July 24
Optus Stad.
CAR
GCS
1:05PMSAT
July 25
Marvel Stad.
HAW
ESS
4:15PMSAT
July 25
MCG
GWS
SYD
4:35PMSAT
July 25
ENGIE Stad.
WBD
RIC
7:40PMSAT
July 25
Marvel Stad.
BRL
PTA
1:10PMSUN
July 26
Gabba
NTH
STK
3:15PMSUN
July 26
Marvel Stad.

Ads provide web developers the support to continue providing their services. If our ads are of annoyance, please provide recommendations to help us improve.
Will Day
Handballs Against the Opposition
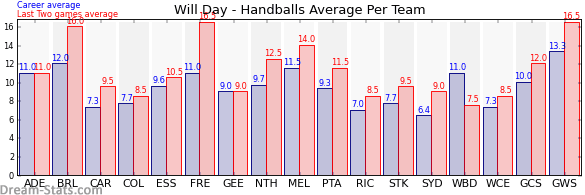
| Team | Games | Last 2 Avg. | Overall Avg. | Difference |
|---|---|---|---|---|
| Fremantle | 5 | 17.0 | 11.6 | 5.4 |
| Brisbane | 3 | 16.0 | 12.0 | 4.0 |
| West Coast | 4 | 16.0 | 10.0 | 6.0 |
| Collingwood | 4 | 15.0 | 9.8 | 5.2 |
| Western Sydney | 7 | 13.5 | 12.6 | 0.9 |
| North Melbourne | 3 | 12.5 | 9.7 | 2.8 |
| Gold Coast | 5 | 12.0 | 9.8 | 2.2 |
| Port Adelaide | 3 | 11.5 | 9.3 | 2.2 |
| St. Kilda | 7 | 11.5 | 7.9 | 3.6 |
| Adelaide | 3 | 10.0 | 10.3 | -0.3 |
| Geelong | 2 | 9.0 | 9.0 | 0.0 |
| Essendon | 6 | 8.5 | 9.2 | -0.7 |
| Melbourne | 5 | 8.5 | 10.8 | -2.3 |
| Western Bulldogs | 6 | 8.0 | 11.5 | -3.5 |
| Carlton | 7 | 7.5 | 8.0 | -0.5 |
| Richmond | 6 | 6.0 | 6.0 | 0.0 |
| Sydney | 6 | 6.0 | 6.8 | -0.8 |
Ads provide web developers the support to continue providing their services. If our ads are of annoyance, please provide recommendations to help us improve.