 Darcy Byrne-Jones

17
BYE
NA
COL
NTH
7:40PMFRI
July 10
Marvel Stad.
STK
PTA
1:15PMSAT
July 11
Marvel Stad.
GWS
GEE
4:15PMSAT
July 11
ENGIE Stad.
CAR
HAW
7:35PMSAT
July 11
MCG
ADE
GCS
8:10PMSAT
July 11
Adelaide Oval
WBD
WCE
1:10PMSUN
July 12
Marvel Stad.
MEL
RIC
3:15PMSUN
July 12
MCG
BRL
ESS
4:40PMSUN
July 12
Gabba

Ads provide web developers the support to continue providing their services. If our ads are of annoyance, please provide recommendations to help us improve.
Darcy Byrne-Jones
Disposals Against the Opposition
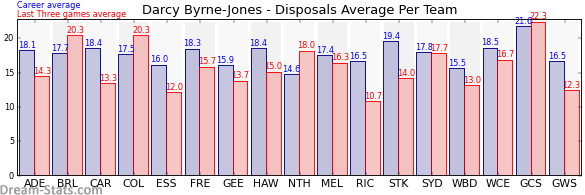
| Team | Games | Last 3 Avg. | Overall Avg. | Difference |
|---|---|---|---|---|
| Collingwood | 13 | 19.3 | 18.2 | 1.1 |
| Richmond | 17 | 18.7 | 16.9 | 1.8 |
| West Coast | 15 | 18.7 | 18.5 | 0.2 |
| Gold Coast | 11 | 18.3 | 20.7 | -2.4 |
| Sydney | 13 | 17.0 | 15.7 | 1.3 |
| Fremantle | 14 | 15.0 | 17.6 | -2.6 |
| North Melbourne | 11 | 14.7 | 14.6 | 0.1 |
| Geelong | 17 | 14.0 | 15.8 | -1.8 |
| Essendon | 13 | 13.7 | 15.6 | -1.9 |
| Adelaide | 20 | 13.7 | 16.9 | -3.2 |
| Western Bulldogs | 15 | 13.3 | 15.1 | -1.8 |
| Carlton | 13 | 13.0 | 16.4 | -3.4 |
| Hawthorn | 12 | 12.7 | 17.0 | -4.3 |
| Melbourne | 13 | 12.3 | 16.7 | -4.4 |
| St. Kilda | 12 | 11.7 | 17.5 | -5.8 |
| Brisbane | 14 | 10.3 | 16.8 | -6.5 |
| Western Sydney | 12 | 9.7 | 15.8 | -6.1 |
Ads provide web developers the support to continue providing their services. If our ads are of annoyance, please provide recommendations to help us improve.