 Mabior Chol

17
BYE
NA
GEE
STK
7:30PMTHU
July 16
GMHBA Stad.
SYD
ADE
7:40PMFRI
July 17
SCG
PTA
FRE
1:15PMSAT
July 18
Adelaide Oval
NTH
MEL
4:15PMSAT
July 18
Marvel Stad.
COL
CAR
7:35PMSAT
July 18
MCG
WCE
BRL
8:10PMSAT
July 18
Optus Stad.
RIC
HAW
1:10PMSUN
July 19
MCG
GCS
WBD
3:15PMSUN
July 19
People First Stad.
ESS
GWS
4:40PMSUN
July 19
Marvel Stad.

Ads provide web developers the support to continue providing their services. If our ads are of annoyance, please provide recommendations to help us improve.
Mabior Chol
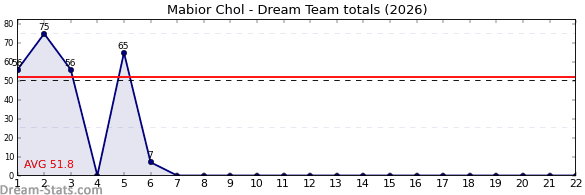
2026 Fixture And Results - Dream Team
| Round | Opponent | Previous 3 Games | AVG. | This Game | Diff. | |||
|---|---|---|---|---|---|---|---|---|
| 1 | Western Sydney | 48 | 21 | 69 | 46.0 | 56 | +10.0 | Full View |
| 2 | Essendon | 47 | 65 | 61 | 57.7 | 75 | +17.3 | Full View |
| 3 | Sydney | 47 | 50 | 44 | 47.0 | 56 | +9.0 | Full View |
| 5 | Geelong | 56 | 88 | 90 | 78.0 | 65 | -13.0 | Full View |
| 6 | Western Bulldogs | 48 | 22 | 63 | 44.3 | 7 | -37.3 | Full View |
| 7 | Port Adelaide | 53 | 43 | 35 | 43.7 | - | - | Full View |
| 8 | Gold Coast | 78 | 46 | 75 | 66.3 | - | - | Full View |
| 9 | Collingwood | 71 | 62 | 88 | 73.7 | - | - | Full View |
| 10 | Fremantle | 53 | 44 | 36 | 44.3 | - | - | Full View |
| 11 | Melbourne | 55 | 36 | 30 | 40.3 | - | - | Full View |
| 12 | Adelaide | 56 | 40 | 58 | 51.3 | 56 | +4.7 | Full View |
| 13 | St. Kilda | 55 | 25 | 55 | 45.0 | 63 | +18.0 | Full View |
| 14 | Western Bulldogs | 22 | 63 | 7 | 30.7 | 76 | +45.3 | Full View |
| 16 | Gold Coast | 78 | 46 | 75 | 66.3 | 48 | -18.3 | Full View |
| 17 | Western Sydney | 21 | 69 | 56 | 48.7 | 67 | +18.3 | Full View |
| 18 | Melbourne | 55 | 36 | 30 | 40.3 | 98 | +57.7 | Full View |
| 19 | Carlton | 63 | 40 | 57 | 53.3 | - | - | Full View |
| 20 | Richmond | 59 | 89 | 77 | 75.0 | - | - | Full View |
| 21 | Essendon | 65 | 61 | 75 | 67.0 | - | - | Full View |
| 22 | North Melbourne | 89 | 53 | 97 | 79.7 | - | - | Full View |
| 23 | Brisbane | 79 | 43 | 77 | 66.3 | - | - | Full View |
| 24 | Collingwood | 71 | 62 | 88 | 73.7 | - | - | Full View |
| 25 | West Coast | 38 | 68 | 114 | 73.3 | - | - | Full View |
Ads provide web developers the support to continue providing their services. If our ads are of annoyance, please provide recommendations to help us improve.