 Darcy Byrne-Jones

GF
BYE
NA

Ads provide web developers the support to continue providing their services. If our ads are of annoyance, please provide recommendations to help us improve.
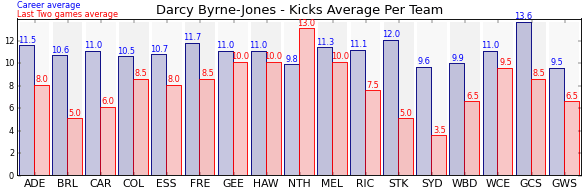
Darcy Byrne-Jones
Kicks Against the Opposition
| Team | Games | Last 2 Avg. | Overall Avg. | Difference |
|---|---|---|---|---|
| Essendon | 12 | 11.0 | 10.8 | 0.2 |
| Hawthorn | 11 | 11.0 | 11.0 | 0.0 |
| Richmond | 16 | 11.0 | 11.3 | -0.3 |
| North Melbourne | 9 | 10.0 | 9.8 | 0.2 |
| Melbourne | 13 | 9.5 | 11.0 | -1.5 |
| West Coast | 13 | 9.5 | 11.1 | -1.6 |
| Sydney | 12 | 9.0 | 9.5 | -0.5 |
| Fremantle | 14 | 9.0 | 11.3 | -2.3 |
| Geelong | 16 | 8.5 | 10.7 | -2.2 |
| Western Sydney | 12 | 7.5 | 9.3 | -1.8 |
| Gold Coast | 10 | 6.5 | 13.2 | -6.7 |
| Carlton | 12 | 6.5 | 10.3 | -3.8 |
| Brisbane | 14 | 6.5 | 10.4 | -3.9 |
| Western Bulldogs | 14 | 6.5 | 9.5 | -3.0 |
| Adelaide | 18 | 6.5 | 10.9 | -4.4 |
| Collingwood | 12 | 6.0 | 10.0 | -4.0 |
| St. Kilda | 11 | 2.5 | 11.0 | -8.5 |
Ads provide web developers the support to continue providing their services. If our ads are of annoyance, please provide recommendations to help us improve.