 Jack Darling

2
BYE
GCS HAW SYD WBD
STK
BRL
12:35PMSAT
March 28
Marvel Stad.
FRE
RIC
4:15PMSAT
March 28
Optus Stad.
ESS
NTH
7:35PMSAT
March 28
Marvel Stad.
PTA
WCE
12:30PMSUN
March 29
Adelaide Oval
CAR
MEL
3:15PMSUN
March 29
MCG

Ads provide web developers the support to continue providing their services. If our ads are of annoyance, please provide recommendations to help us improve.
Jack Darling
DT Average Against the Opposition
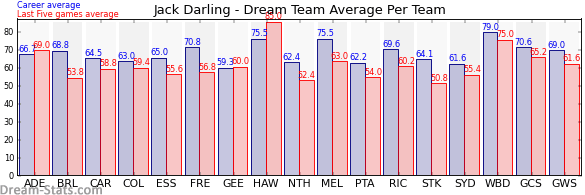
| Team | Games | Last 5 Avg. | Overall Avg. | Difference |
|---|---|---|---|---|
| Gold Coast | 17 | 82.2 | 74.2 | 8.0 |
| Western Bulldogs | 21 | 71.0 | 78.5 | -7.5 |
| Melbourne | 21 | 67.8 | 75.5 | -7.7 |
| Hawthorn | 19 | 65.6 | 70.4 | -4.8 |
| Western Sydney | 17 | 64.2 | 68.9 | -4.7 |
| Richmond | 18 | 62.4 | 69.2 | -6.8 |
| Adelaide | 22 | 59.4 | 64.6 | -5.2 |
| Port Adelaide | 19 | 57.8 | 62.6 | -4.8 |
| St. Kilda | 17 | 57.4 | 64.4 | -7.0 |
| North Melbourne | 18 | 54.8 | 60.2 | -5.4 |
| Geelong | 17 | 52.6 | 58.8 | -6.2 |
| Collingwood | 23 | 52.0 | 62.2 | -10.2 |
| Brisbane | 13 | 50.8 | 67.6 | -16.8 |
| Essendon | 17 | 50.2 | 60.9 | -10.7 |
| Fremantle | 26 | 49.0 | 68.7 | -19.7 |
| Carlton | 17 | 42.0 | 58.9 | -16.9 |
| Sydney | 15 | 40.6 | 58.0 | -17.4 |
| West Coast | 2 | 34.5 | 34.5 | 0.0 |
Ads provide web developers the support to continue providing their services. If our ads are of annoyance, please provide recommendations to help us improve.