 Nathan Lovett-Murray

GF
BYE
NA

Ads provide web developers the support to continue providing their services. If our ads are of annoyance, please provide recommendations to help us improve.
Nathan Lovett-Murray
DT Average Against the Opposition
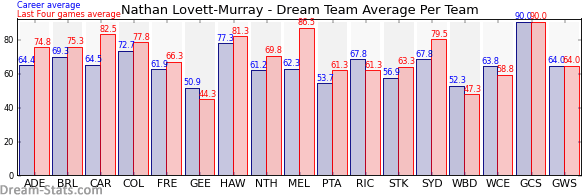
| Team | Games | Last 4 Avg. | Overall Avg. | Difference |
|---|---|---|---|---|
| Gold Coast | 1 | 90.0 | 90.0 | 0.0 |
| Melbourne | 8 | 86.5 | 62.3 | 24.2 |
| Carlton | 11 | 82.5 | 64.5 | 18.0 |
| Hawthorn | 11 | 81.3 | 77.3 | 4.0 |
| Sydney | 9 | 79.5 | 67.8 | 11.7 |
| Collingwood | 10 | 77.8 | 72.7 | 5.1 |
| Brisbane | 8 | 75.3 | 69.3 | 6.0 |
| Adelaide | 10 | 74.8 | 64.4 | 10.4 |
| North Melbourne | 5 | 69.8 | 61.2 | 8.6 |
| Fremantle | 8 | 66.3 | 61.9 | 4.4 |
| Western Sydney | 2 | 64.0 | 64.0 | 0.0 |
| St. Kilda | 8 | 63.3 | 56.9 | 6.4 |
| Richmond | 13 | 61.3 | 67.8 | -6.5 |
| Port Adelaide | 9 | 61.3 | 53.7 | 7.6 |
| West Coast | 13 | 58.8 | 63.8 | -5.0 |
| Western Bulldogs | 11 | 47.3 | 52.3 | -5.0 |
| Geelong | 8 | 44.3 | 50.9 | -6.6 |
Ads provide web developers the support to continue providing their services. If our ads are of annoyance, please provide recommendations to help us improve.