 Kane Lambert

GF
BYE
NA
SYD
GWS
4:10PMTHU
February 26
Henson Park
BRL
GCS
7:10PMTHU
February 26
Brighton Homes Arena
MEL
RIC
4:10PMFRI
February 27
Mars Stad.
WBD
HAW
7:10PMFRI
February 27
Mission Whitten Oval
STK
ESS
3:10PMSAT
February 28
Mars Stad.
FRE
ADE
6:10PMSAT
February 28
Rushton Park
NTH
COL
3:10PMSUN
March 01
Mars Stad.
WCE
PTA
6:10PMSUN
March 01
Mineral Resources Park

Ads provide web developers the support to continue providing their services. If our ads are of annoyance, please provide recommendations to help us improve.
Kane Lambert
DT Average Against the Opposition
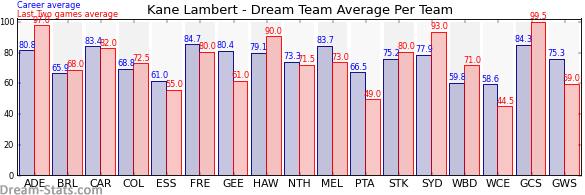
| Team | Games | Last 2 Avg. | Overall Avg. | Difference |
|---|---|---|---|---|
| Gold Coast | 6 | 99.5 | 84.3 | 15.2 |
| Adelaide | 6 | 97.0 | 80.8 | 16.2 |
| Sydney | 7 | 93.0 | 77.9 | 15.1 |
| Hawthorn | 8 | 90.0 | 79.1 | 10.9 |
| Carlton | 9 | 82.0 | 83.4 | -1.4 |
| Fremantle | 7 | 80.0 | 84.7 | -4.7 |
| St. Kilda | 11 | 80.0 | 75.2 | 4.8 |
| Melbourne | 7 | 73.0 | 83.7 | -10.7 |
| Collingwood | 9 | 72.5 | 68.8 | 3.7 |
| North Melbourne | 7 | 71.5 | 73.3 | -1.8 |
| Western Bulldogs | 4 | 71.0 | 59.8 | 11.2 |
| Brisbane | 9 | 68.0 | 65.9 | 2.1 |
| Geelong | 8 | 61.0 | 80.4 | -19.4 |
| Western Sydney | 10 | 59.0 | 75.3 | -16.3 |
| Essendon | 5 | 55.0 | 61.0 | -6.0 |
| Port Adelaide | 10 | 49.0 | 66.5 | -17.5 |
| West Coast | 8 | 44.5 | 58.6 | -14.1 |
Ads provide web developers the support to continue providing their services. If our ads are of annoyance, please provide recommendations to help us improve.