 Nathan Jones

2
BYE
STK GWS
BRL
COL
7:30PMTHU
April 02
Gabba
NTH
CAR
3:15PMFRI
April 03
Marvel Stad.
ADE
FRE
7:15PMFRI
April 03
Adelaide Oval
RIC
PTA
4:15PMSAT
April 04
MCG
WCE
SYD
7:35PMSAT
April 04
Optus Stad.
MEL
GCS
3:15PMSUN
April 05
MCG
WBD
ESS
7:20PMSUN
April 05
Marvel Stad.
HAW
GEE
3:15PMMON
April 06
MCG

Ads provide web developers the support to continue providing their services. If our ads are of annoyance, please provide recommendations to help us improve.
Nathan Jones
Disposals Against the Opposition
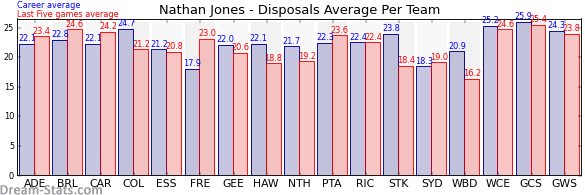
| Team | Games | Last 5 Avg. | Overall Avg. | Difference |
|---|---|---|---|---|
| Gold Coast | 13 | 25.4 | 25.9 | -0.5 |
| Brisbane | 17 | 24.6 | 22.8 | 1.8 |
| West Coast | 17 | 24.6 | 25.2 | -0.6 |
| Carlton | 16 | 24.2 | 22.1 | 2.1 |
| Western Sydney | 12 | 23.8 | 24.3 | -0.5 |
| Port Adelaide | 19 | 23.6 | 22.3 | 1.3 |
| Adelaide | 17 | 23.4 | 22.1 | 1.3 |
| Fremantle | 20 | 23.0 | 17.9 | 5.1 |
| Richmond | 20 | 22.4 | 22.4 | 0.0 |
| Collingwood | 21 | 21.2 | 24.7 | -3.5 |
| Essendon | 11 | 20.8 | 21.2 | -0.4 |
| Geelong | 19 | 20.6 | 22.0 | -1.4 |
| North Melbourne | 21 | 19.2 | 21.7 | -2.5 |
| Sydney | 15 | 19.0 | 18.3 | 0.7 |
| Hawthorn | 19 | 18.8 | 22.1 | -3.3 |
| St. Kilda | 23 | 18.4 | 23.8 | -5.4 |
| Western Bulldogs | 21 | 16.2 | 20.9 | -4.7 |
Ads provide web developers the support to continue providing their services. If our ads are of annoyance, please provide recommendations to help us improve.