 Grant Birchall

2
BYE
BRL CAR COL GEE
PTA
ESS
3:15PMSUN
March 22
Adelaide Oval
WCE
NTH
6:10PMSUN
March 22
Optus Stad.

Ads provide web developers the support to continue providing their services. If our ads are of annoyance, please provide recommendations to help us improve.
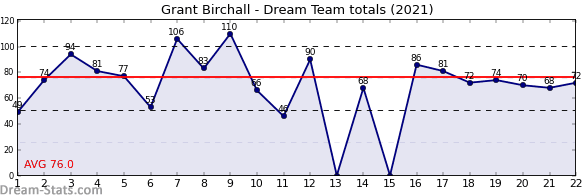
Grant Birchall
2021 Yearly Statistics
| OPP | RND | DT | D | K | H | M | T | HO | FF | FA | G | B |
|---|---|---|---|---|---|---|---|---|---|---|---|---|
| SYD | 1 | 49 | 11 | 8 | 3 | 5 | 1 | 0 | 0 | 0 | 0 | 0 |
| GEE | 2 | 74 | 17 | 15 | 2 | 7 | 1 | 0 | 0 | 0 | 0 | 0 |
| COL | 3 | 94 | 22 | 14 | 8 | 12 | 0 | 0 | 0 | 0 | 0 | 0 |
| WBD | 4 | 81 | 21 | 18 | 3 | 7 | 0 | 0 | 0 | 0 | 0 | 0 |
| ESS | 5 | 77 | 18 | 15 | 3 | 7 | 2 | 0 | 0 | 1 | 0 | 0 |
| CAR | 6 | 53 | 16 | 9 | 7 | 6 | 0 | 0 | 0 | 2 | 0 | 0 |
| PTA | 7 | 106 | 25 | 18 | 7 | 10 | 2 | 0 | 0 | 0 | 0 | 0 |
| FRE | 8 | 83 | 21 | 14 | 7 | 9 | 0 | 0 | 0 | 0 | 0 | 0 |
| GCS | 9 | 110 | 26 | 19 | 7 | 13 | 0 | 0 | 0 | 0 | 0 | 0 |
| RIC | 10 | 66 | 15 | 13 | 2 | 5 | 2 | 0 | 0 | 0 | 0 | 0 |
| GWS | 11 | 46 | 9 | 9 | 0 | 5 | 1 | 0 | 0 | 0 | 0 | 0 |
| MEL | 12 | 90 | 18 | 16 | 2 | 10 | 2 | 0 | 0 | 0 | 0 | 0 |
| NTH | 14 | 68 | 22 | 15 | 7 | 4 | 0 | 0 | 0 | 1 | 0 | 0 |
| ADE | 16 | 86 | 25 | 14 | 11 | 4 | 2 | 0 | 2 | 0 | 0 | 0 |
| STK | 17 | 81 | 18 | 14 | 4 | 7 | 1 | 0 | 0 | 0 | 1 | 0 |
| RIC | 18 | 72 | 17 | 12 | 5 | 6 | 2 | 0 | 0 | 0 | 0 | 0 |
| GCS | 19 | 74 | 18 | 13 | 5 | 9 | 1 | 0 | 0 | 2 | 0 | 0 |
| HAW | 20 | 70 | 18 | 10 | 8 | 8 | 0 | 0 | 0 | 0 | 0 | 0 |
| FRE | 21 | 68 | 21 | 10 | 11 | 4 | 1 | 0 | 0 | 0 | 0 | 0 |
| COL | 22 | 72 | 17 | 13 | 4 | 5 | 1 | 0 | 0 | 0 | 1 | 0 |
| WCE | 23 | 72 | 17 | 13 | 4 | 6 | 3 | 0 | 1 | 2 | 0 | 0 |
| MEL | 24 | 58 | 15 | 13 | 2 | 6 | 0 | 0 | 0 | 1 | 0 | 0 |
| WBD | 25 | 64 | 18 | 12 | 6 | 4 | 1 | 0 | 0 | 0 | 0 | 0 |
| SUM | 1714 | 425 | 307 | 118 | 159 | 23 | 0 | 3 | 9 | 2 | 0 | |
| AVG | 74.5 | 18.5 | 13.3 | 5.1 | 6.9 | 1.0 | 0.0 | 0.1 | 0.4 | 0.1 | 0.0 |
Ads provide web developers the support to continue providing their services. If our ads are of annoyance, please provide recommendations to help us improve.