 Reilly O'Brien

3
BYE
NA

Ads provide web developers the support to continue providing their services. If our ads are of annoyance, please provide recommendations to help us improve.
Reilly O'Brien
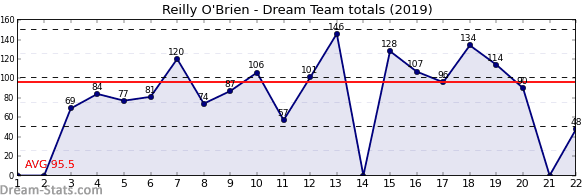
2019 Yearly Statistics
| OPP | RND | DT | D | K | H | M | T | HO | FF | FA | G | B |
|---|---|---|---|---|---|---|---|---|---|---|---|---|
| GEE | 3 | 69 | 11 | 5 | 6 | 3 | 3 | 28 | 2 | 3 | 0 | 0 |
| GCS | 5 | 77 | 12 | 2 | 10 | 4 | 2 | 34 | 3 | 2 | 0 | 0 |
| NTH | 4 | 84 | 16 | 10 | 6 | 6 | 5 | 14 | 2 | 4 | 0 | 0 |
| STK | 6 | 81 | 11 | 3 | 8 | 4 | 4 | 36 | 1 | 3 | 0 | 0 |
| FRE | 7 | 120 | 22 | 7 | 15 | 5 | 3 | 44 | 0 | 1 | 0 | 1 |
| PTA | 8 | 74 | 10 | 6 | 4 | 0 | 5 | 34 | 0 | 2 | 0 | 0 |
| BRL | 9 | 87 | 13 | 4 | 9 | 2 | 3 | 37 | 2 | 0 | 0 | 0 |
| WCE | 10 | 106 | 13 | 4 | 9 | 4 | 7 | 40 | 2 | 2 | 0 | 0 |
| MEL | 11 | 57 | 7 | 3 | 4 | 1 | 3 | 34 | 0 | 3 | 0 | 0 |
| GWS | 12 | 101 | 17 | 14 | 3 | 3 | 3 | 29 | 2 | 0 | 0 | 1 |
| RIC | 13 | 146 | 19 | 9 | 10 | 5 | 7 | 54 | 2 | 0 | 0 | 0 |
| GEE | 15 | 128 | 18 | 11 | 7 | 2 | 7 | 39 | 2 | 0 | 1 | 0 |
| PTA | 16 | 107 | 20 | 10 | 10 | 5 | 4 | 27 | 2 | 1 | 0 | 0 |
| GCS | 17 | 96 | 19 | 8 | 11 | 1 | 6 | 36 | 2 | 7 | 1 | 0 |
| ESS | 18 | 134 | 27 | 12 | 15 | 3 | 4 | 39 | 4 | 0 | 0 | 0 |
| CAR | 19 | 114 | 20 | 10 | 10 | 8 | 2 | 32 | 2 | 1 | 0 | 1 |
| STK | 20 | 90 | 12 | 5 | 7 | 2 | 7 | 31 | 2 | 2 | 0 | 0 |
| COL | 22 | 48 | 9 | 3 | 6 | 2 | 2 | 12 | 3 | 1 | 0 | 1 |
| SUM | 1719 | 276 | 126 | 150 | 60 | 77 | 600 | 33 | 32 | 2 | 4 | |
| AVG | 95.5 | 15.3 | 7.0 | 8.3 | 3.3 | 4.3 | 33.3 | 1.8 | 1.8 | 0.1 | 0.2 |
Ads provide web developers the support to continue providing their services. If our ads are of annoyance, please provide recommendations to help us improve.