 Jack Redpath

GF
BYE
NA
MEL
RIC
4:10PMFRI
February 27
Mars Stad.
WBD
HAW
7:10PMFRI
February 27
Mission Whitten Oval
STK
ESS
3:10PMSAT
February 28
Mars Stad.
FRE
ADE
6:10PMSAT
February 28
Rushton Park
NTH
COL
3:10PMSUN
March 01
Mars Stad.
WCE
PTA
6:10PMSUN
March 01
Mineral Resources Park

Ads provide web developers the support to continue providing their services. If our ads are of annoyance, please provide recommendations to help us improve.
Jack Redpath
2015 Yearly Statistics
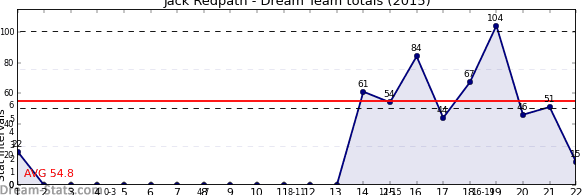
| OPP | RND | DT | D | K | H | M | T | HO | FF | FA | G | B |
|---|---|---|---|---|---|---|---|---|---|---|---|---|
| WCE | 1 | 22 | 5 | 4 | 1 | 1 | 0 | 1 | 1 | 1 | 1 | 0 |
| CAR | 14 | 61 | 9 | 8 | 1 | 7 | 3 | 1 | 0 | 0 | 0 | 1 |
| GCS | 15 | 54 | 8 | 7 | 1 | 4 | 1 | 0 | 1 | 2 | 3 | 2 |
| GEE | 16 | 84 | 7 | 6 | 1 | 5 | 10 | 2 | 0 | 0 | 1 | 1 |
| COL | 17 | 44 | 10 | 7 | 3 | 4 | 1 | 3 | 2 | 4 | 1 | 2 |
| ESS | 18 | 67 | 13 | 10 | 3 | 5 | 2 | 3 | 3 | 0 | 0 | 2 |
| PTA | 19 | 104 | 13 | 10 | 3 | 9 | 4 | 3 | 1 | 1 | 4 | 0 |
| MEL | 20 | 46 | 8 | 7 | 1 | 2 | 1 | 4 | 0 | 1 | 2 | 0 |
| WCE | 21 | 51 | 10 | 6 | 4 | 2 | 3 | 8 | 1 | 5 | 2 | 1 |
| NTH | 22 | 15 | 5 | 1 | 4 | 2 | 0 | 4 | 0 | 2 | 0 | 0 |
| BRL | 23 | 80 | 13 | 8 | 5 | 3 | 2 | 10 | 1 | 0 | 3 | 0 |
| ADE | 24 | 66 | 7 | 6 | 1 | 6 | 3 | 4 | 0 | 0 | 2 | 0 |
| SUM | 694 | 108 | 80 | 28 | 50 | 30 | 43 | 10 | 16 | 19 | 9 | |
| AVG | 57.8 | 9.0 | 6.7 | 2.3 | 4.2 | 2.5 | 3.6 | 0.8 | 1.3 | 1.6 | 0.8 |
Ads provide web developers the support to continue providing their services. If our ads are of annoyance, please provide recommendations to help us improve.