 Jack Crisp

3
BYE
NA
COL
FRE
7:40PMFRI
April 10
Adelaide Oval
NTH
BRL
12:35PMSAT
April 11
Barossa Park
ESS
MEL
1:15PMSAT
April 11
Adelaide Oval
SYD
GCS
4:15PMSAT
April 11
Norwood Oval
HAW
WBD
7:35PMSAT
April 11
Adelaide Oval
GEE
WCE
12:30PMSUN
April 12
Norwood Oval
GWS
RIC
3:15PMSUN
April 12
Barossa Park
PTA
STK
7:15PMSUN
April 12
Adelaide Oval

Ads provide web developers the support to continue providing their services. If our ads are of annoyance, please provide recommendations to help us improve.
Jack Crisp
2015 Yearly Statistics
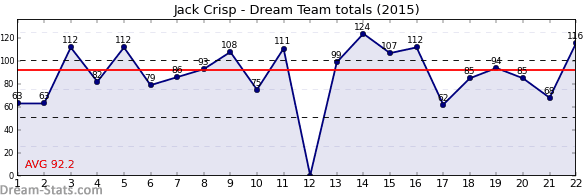
| OPP | RND | DT | D | K | H | M | T | HO | FF | FA | G | B |
|---|---|---|---|---|---|---|---|---|---|---|---|---|
| BRL | 1 | 63 | 12 | 7 | 5 | 1 | 5 | 0 | 2 | 0 | 1 | 1 |
| ADE | 2 | 63 | 17 | 10 | 7 | 4 | 1 | 0 | 1 | 0 | 0 | 2 |
| STK | 3 | 112 | 23 | 13 | 10 | 5 | 9 | 0 | 2 | 2 | 1 | 0 |
| ESS | 4 | 82 | 21 | 13 | 8 | 4 | 4 | 0 | 2 | 3 | 1 | 0 |
| CAR | 5 | 112 | 26 | 15 | 11 | 4 | 8 | 0 | 0 | 2 | 1 | 1 |
| GEE | 6 | 79 | 18 | 12 | 6 | 3 | 4 | 1 | 2 | 1 | 1 | 0 |
| RIC | 7 | 86 | 20 | 13 | 7 | 5 | 2 | 0 | 1 | 1 | 2 | 0 |
| GCS | 8 | 93 | 27 | 11 | 16 | 5 | 3 | 0 | 0 | 0 | 0 | 1 |
| NTH | 9 | 108 | 19 | 14 | 5 | 3 | 11 | 0 | 0 | 1 | 1 | 0 |
| MEL | 10 | 75 | 21 | 10 | 11 | 3 | 4 | 1 | 0 | 1 | 0 | 0 |
| GWS | 11 | 111 | 28 | 15 | 13 | 3 | 5 | 0 | 1 | 1 | 2 | 1 |
| FRE | 13 | 99 | 20 | 18 | 2 | 3 | 7 | 0 | 1 | 1 | 1 | 0 |
| HAW | 14 | 124 | 28 | 19 | 9 | 5 | 7 | 0 | 2 | 1 | 1 | 1 |
| PTA | 15 | 107 | 22 | 15 | 7 | 3 | 8 | 1 | 0 | 0 | 1 | 0 |
| WCE | 16 | 112 | 31 | 12 | 19 | 6 | 5 | 0 | 0 | 0 | 0 | 0 |
| WBD | 17 | 62 | 15 | 8 | 7 | 3 | 4 | 0 | 2 | 1 | 0 | 0 |
| MEL | 18 | 85 | 25 | 14 | 11 | 3 | 3 | 0 | 0 | 0 | 0 | 0 |
| CAR | 19 | 94 | 23 | 14 | 9 | 4 | 4 | 1 | 2 | 1 | 1 | 0 |
| SYD | 20 | 85 | 24 | 14 | 10 | 5 | 0 | 0 | 1 | 0 | 1 | 1 |
| RIC | 21 | 68 | 18 | 10 | 8 | 4 | 2 | 0 | 0 | 0 | 0 | 2 |
| GEE | 22 | 116 | 31 | 16 | 15 | 4 | 7 | 1 | 3 | 2 | 0 | 0 |
| ESS | 23 | 75 | 15 | 9 | 6 | 5 | 3 | 2 | 1 | 0 | 1 | 0 |
| SUM | 2011 | 484 | 282 | 202 | 85 | 106 | 7 | 23 | 18 | 16 | 10 | |
| AVG | 91.4 | 22.0 | 12.8 | 9.2 | 3.9 | 4.8 | 0.3 | 1.0 | 0.8 | 0.7 | 0.5 |
Ads provide web developers the support to continue providing their services. If our ads are of annoyance, please provide recommendations to help us improve.