 Ben Rutten

OR
BYE
BRL CAR COL GEE
HAW
SYD
7:30PMTHU
March 19
MCG
ADE
WBD
7:40PMFRI
March 20
Adelaide Oval
RIC
GCS
1:15PMSAT
March 21
MCG
GWS
STK
4:15PMSAT
March 21
ENGIE Stad.
FRE
MEL
7:35PMSAT
March 21
Optus Stad.
PTA
ESS
3:15PMSUN
March 22
Adelaide Oval
WCE
NTH
6:10PMSUN
March 22
Optus Stad.

Ads provide web developers the support to continue providing their services. If our ads are of annoyance, please provide recommendations to help us improve.
Ben Rutten
2010 Yearly Statistics
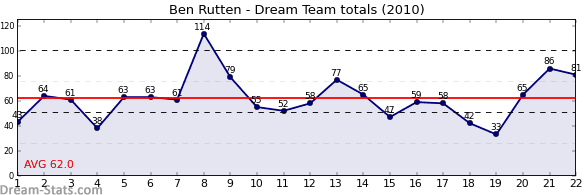
| OPP | RND | DT | D | K | H | M | T | HO | FF | FA | G | B |
|---|---|---|---|---|---|---|---|---|---|---|---|---|
| FRE | 1 | 43 | 9 | 2 | 7 | 2 | 4 | 0 | 1 | 0 | 0 | 0 |
| SYD | 2 | 64 | 16 | 4 | 12 | 5 | 3 | 0 | 1 | 0 | 0 | 0 |
| MEL | 3 | 61 | 14 | 8 | 6 | 7 | 1 | 0 | 0 | 0 | 0 | 0 |
| CAR | 4 | 38 | 12 | 3 | 9 | 2 | 2 | 0 | 0 | 1 | 0 | 0 |
| WBD | 5 | 63 | 19 | 6 | 13 | 5 | 1 | 0 | 0 | 0 | 0 | 0 |
| PTA | 6 | 63 | 13 | 9 | 4 | 6 | 3 | 0 | 1 | 1 | 0 | 0 |
| RIC | 7 | 61 | 15 | 4 | 11 | 5 | 3 | 0 | 0 | 0 | 0 | 0 |
| NTH | 8 | 114 | 24 | 14 | 10 | 16 | 1 | 0 | 0 | 0 | 0 | 0 |
| BRL | 9 | 79 | 24 | 6 | 18 | 5 | 2 | 0 | 2 | 0 | 0 | 0 |
| STK | 10 | 55 | 17 | 6 | 11 | 6 | 0 | 0 | 0 | 1 | 0 | 0 |
| FRE | 11 | 52 | 13 | 3 | 10 | 5 | 2 | 0 | 0 | 0 | 0 | 0 |
| HAW | 12 | 58 | 13 | 5 | 8 | 5 | 3 | 0 | 0 | 0 | 0 | 0 |
| MEL | 13 | 77 | 19 | 6 | 13 | 7 | 3 | 0 | 0 | 0 | 0 | 0 |
| ESS | 14 | 65 | 15 | 4 | 11 | 5 | 4 | 0 | 0 | 0 | 0 | 0 |
| WCE | 15 | 47 | 13 | 5 | 8 | 5 | 1 | 0 | 0 | 1 | 0 | 0 |
| GEE | 16 | 59 | 18 | 7 | 11 | 6 | 1 | 0 | 0 | 2 | 0 | 0 |
| PTA | 17 | 58 | 14 | 6 | 8 | 5 | 2 | 0 | 1 | 0 | 0 | 0 |
| RIC | 18 | 42 | 11 | 4 | 7 | 5 | 1 | 0 | 0 | 1 | 0 | 0 |
| WBD | 19 | 33 | 11 | 3 | 8 | 1 | 1 | 0 | 1 | 0 | 0 | 0 |
| BRL | 20 | 65 | 14 | 7 | 7 | 7 | 2 | 0 | 1 | 0 | 0 | 0 |
| COL | 21 | 86 | 20 | 9 | 11 | 8 | 3 | 0 | 1 | 0 | 0 | 0 |
| STK | 22 | 81 | 16 | 7 | 9 | 10 | 3 | 0 | 0 | 0 | 0 | 0 |
| SUM | 1364 | 340 | 128 | 212 | 128 | 46 | 0 | 9 | 7 | 0 | 0 | |
| AVG | 62.0 | 15.5 | 5.8 | 9.6 | 5.8 | 2.1 | 0.0 | 0.4 | 0.3 | 0.0 | 0.0 |
Ads provide web developers the support to continue providing their services. If our ads are of annoyance, please provide recommendations to help us improve.